
Rollups, Validiums, and Optimiums all promise to turbocharge Ethereum’s throughput, but when you peek under the hood of rollup activity metrics, it’s clear that rollups are taking the checkered flag while Validiums and Optimiums are sputtering in the pit lane. The numbers don’t lie: user activity, TVL, and developer attention are flocking to rollups, despite Validiums and Optimiums waving their “lower fees” banners like overenthusiastic parade marshals. Why? It comes down to trust, transparency, and a healthy dose of regulatory reality.
Rollups: The Data-Driven Darlings of Ethereum L2
Let’s start with why rollup activity metrics are so robust. Rollups process transactions off-chain but post both transaction data and validity proofs directly on Ethereum. This means every transaction is not just processed quickly but also inherits Ethereum’s security guarantees. You get speed without sacrificing trust - a rare combo in crypto that has developers salivating.
The result? A surge in usage and a steady uptick in on-chain metrics. In fact, as of September 20,2025, with Ethereum trading at $4,474.94, rollup-based protocols have seen record-breaking daily active users and TVL inflows. This is no fluke; it’s the market voting with its feet (and wallets) for solutions that put data availability front and center.
Validiums and amp; Optimiums: Cheaper Isn’t Always Better
If rollups are the golden child at the family reunion, Validiums and Optimiums are the cousins who show up late with a half-eaten bag of chips. Sure, they offer lower costs by keeping transaction data off-chain - but this cost-saving comes with extra trust assumptions. Instead of leveraging Ethereum for data availability, they rely on external committees or DA layers. As a result, users must trust that these off-chain actors won’t go rogue or disappear into the night.
This trade-off hasn’t gone unnoticed by the market. According to sources like Polygon Knowledge Layer, Validiums only post ZK-proofs (validity proofs) to Ethereum - not the underlying transaction data itself. While this keeps fees low and throughput high, it also introduces potential vulnerabilities if those external DA providers drop the ball or act maliciously.
Community and amp; Regulatory Winds Favor Rollups
The Ethereum community is famously allergic to unnecessary trust assumptions - call it PTSD from past rug pulls or just good old-fashioned paranoia. Either way, developers overwhelmingly prefer building on rollups because they align with Ethereum’s decentralization ethos and offer more transparent audit trails.
This preference isn’t just ideological; it has practical implications for regulatory compliance too. Applications storing transaction data on-chain (as rollups do) enjoy greater transparency and can more easily meet audit requirements, a major plus as regulators sharpen their pencils.
Ethereum Technical Analysis Chart
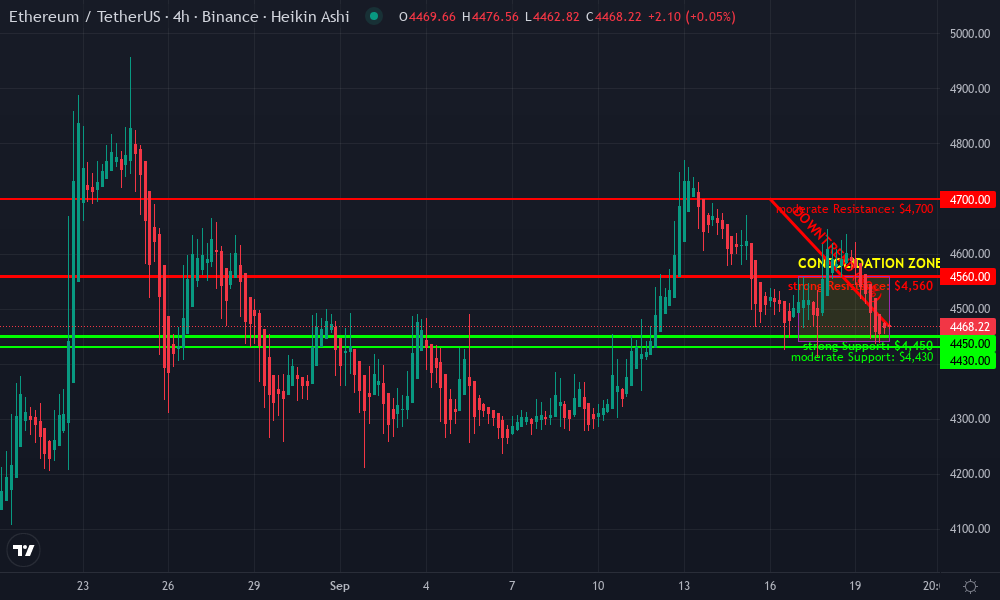
Analysis by Marcus Ellwood | Symbol: BINANCE:ETHUSDT | Interval: 4h | Drawings: 6
Technical Analysis Summary
Start by drawing a horizontal support line at $4,450 and a resistance line at $4,560. Overlay a moderate downtrend line from the recent $4,700+ swing high (mid-September 2025) to the present. Mark the consolidation range between $4,440 and $4,560 over the past few days. Use a rectangle to highlight the sideways chop in this band. Place arrows to indicate potential breakout/breakdown levels. Add a callout near $4,475 for the current price context. For an aggressive play, set up a long position line above $4,560 (breakout) and a short position line below $4,440 (breakdown), with stop losses just outside the consolidation zone.
Tags
Related Articles

Superchain Fault Proofs Guide: Securing OP Stack Multi-Rollups
As Ethereum holds steady at $2,367.91, with a 24-hour gain of $49.57, the Optimism Superchain stands out in a crowded L2 landscape. This network of OP Stack rollups promises seamless scalability and interoperability, but only if superchain...
Apr 16, 2026
Rollup Verification Challenges in OP Superchain Multi-Rollup Networks
Picture a vast network of interconnected highways, each lane a rollup processing transactions at lightning speed, all feeding into Ethereum's main artery. This is the OP Superchain, a multi-rollup ecosystem built on the OP Stack, designed...
Mar 30, 2026
Optimism BPO1 Upgrade Impact on Superchain Rollup Throughput 2026
The Optimism BPO1 upgrade, rolled out on December 9,2025, as part of the Fusaka hardfork, has fundamentally reshaped data availability for OP Stack chains. By bumping the per-block blob target to 10 and the maximum to 15, alongside PeerDAS...
Mar 2, 2026
Optimism Superchain Rollup Deployment Strategies for Ethereum Scalability 2026
As Optimism's OP token trades at $0.1316 , reflecting a negligible 24-hour change of -0.000090% with a daily range between $0.1253 and $0.1339, the Superchain ecosystem stands resilient amid Ethereum's scalability evolution. In early 2026,...
Feb 21, 2026
No comments yet. Be the first to share your thoughts!