
The Superchain, powered by Optimism's OP Stack, has engineered a remarkable ascent in the blockchain landscape, surging to power 14.1% of all crypto transactions by November. This represents nearly 2x transaction growth in just five months, underscoring the multi-rollup vision's potency in scaling Ethereum. As daily transactions hit 20.1 million, capturing 12.7% of total crypto activity, the ecosystem's momentum signals a structural shift toward interoperable Layer 2 solutions.

Dissecting Superchain Transaction Growth
At its core, superchain transaction growth stems from the OP Stack's modular design, enabling seamless rollup deployment across chains like Base, Mode, and World Chain. This federation model funnels activity into a unified security layer, driving efficiencies that L1s and solo L2s struggle to match. From a baseline of roughly 10 million daily transactions earlier in the year, the Superchain rocketed to 20.1 million, a testament to developer adoption and user migration amid Ethereum's scalability crunch.
Consider the rollup ecosystem metrics: the Superchain now commands 61.4% of L2 fee market share, processing 13% of all crypto transactions with shares steadily climbing. Fees generated daily stand at $100.2K, equivalent to 33 ETH, representing 3.1% of crypto-wide fees and 49.5% of L2 totals. This isn't fleeting hype; it's revenue backed by real throughput, positioning Optimism as the most utilized blockchain infrastructure.
Ethereum Superchain Stats Reveal Market Dominance
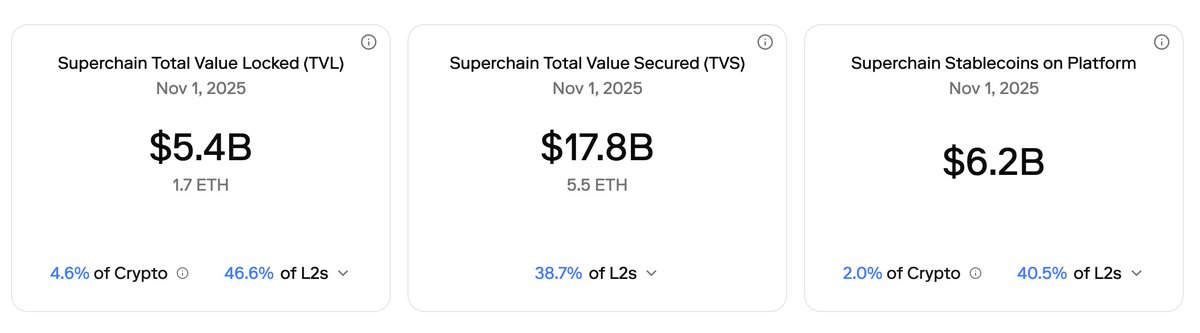
Delving into ethereum superchain stats, the network's TVL has eclipsed $4 billion as of January 2025, fueled by integrations from heavyweights like Coinbase's Base, Kraken, Uniswap, Sony, and even Sam Altman's World. Daily transactions stabilized around 11.5 million while maintaining 60% of Ethereum L2 volume, a figure poised to hit 80% by year-end per industry projections. This OP stack volume surge reflects not just quantitative expansion but qualitative leaps in DeFi liquidity, NFT marketplaces, and social apps thriving under unified sequencing.
What sets this apart is the Superchain's economic flywheel: higher transaction volumes compound sequencer revenues, which in turn fund ecosystem grants and security enhancements. Investors should note the conservative trajectory; even at current levels, the Superchain processes more volume than many L1 competitors combined, with latency and costs plummeting to Ethereum mainnet fractions.
Superchain Metrics Table
| Metric | Value | % of Crypto | % of L2 |
|---|---|---|---|
| Daily Transactions 💹 | 20.1M | 12.7% | 58.6% |
| Daily Fees 💰 | $100.2K / 33 ETH | 3.1% | 49.5% |
| Crypto Txn Share 📈 | 14.1% | ||
| L2 Fee Share 📈 | 61.4% |
Optimism Superchain Adoption Fuels Governance Evolution
Optimism superchain adoption has catalyzed a pivotal governance proposal: allocating 50% of Superchain sequencer revenues toward OP token buybacks. This mechanism directly links token value to ecosystem growth, channeling transaction fees from OP Stack chains into structured ETH purchases and OP reductions. Proponents argue it enhances value capture, mirroring successful models in other protocols while rewarding long-term holders.
With Superchain revenue originating from diverse participants, every transaction across the network contributes to this pool. The Optimism Foundation's move arrives amid a 140% trading volume spike for OP, surpassing $200 million, as markets digest the 'Superchain-as-a-Service' revenue paradigm. For institutional investors, this introduces a defensible moat: recurring buybacks tied to undeniable metrics like the 61.4% L2 dominance.
Sequencer revenues, derived from transaction fees across the Superchain's expanding OP Stack chains, provide a stable funding source for these buybacks. This structured approach ensures that as OP stack volume surge persists, a direct portion funnels back to token holders, creating a self-reinforcing loop. Conservative estimates peg daily fees at $100.2K, but with transaction shares climbing toward 14.1% of crypto total, annualized revenue could easily surpass tens of millions, half of which targets OP deflation.
Value Capture Mechanics in the Superchain Flywheel
The proposal's elegance lies in its simplicity: 50% of net sequencer profits, post-operational costs, convert to ETH holdings auctioned or swapped for OP tokens on open markets. This mirrors mature financial strategies, akin to corporate share repurchases, but decentralized and tied to protocol usage. For context, the Superchain's 49.5% L2 fee dominance translates to substantial inflows; a mere doubling of current volumes could amplify buyback pressure significantly. Investors attuned to rollup ecosystem metrics will appreciate how this decouples OP from speculative narratives, anchoring it to verifiable throughput data.
Market response has been telling. OP trading volumes ballooned 140%, crossing $200 million thresholds, signaling institutional digestion of the 'Superchain-as-a-Service' model. This isn't mere pump; it's pricing in sustainable economics where chains like Base and World Chain contribute seamlessly, their activities aggregated under Optimism's governance. Yet, execution hinges on community ratification, a process underscoring the Superchain's decentralized ethos.
Optimism Technical Analysis Chart
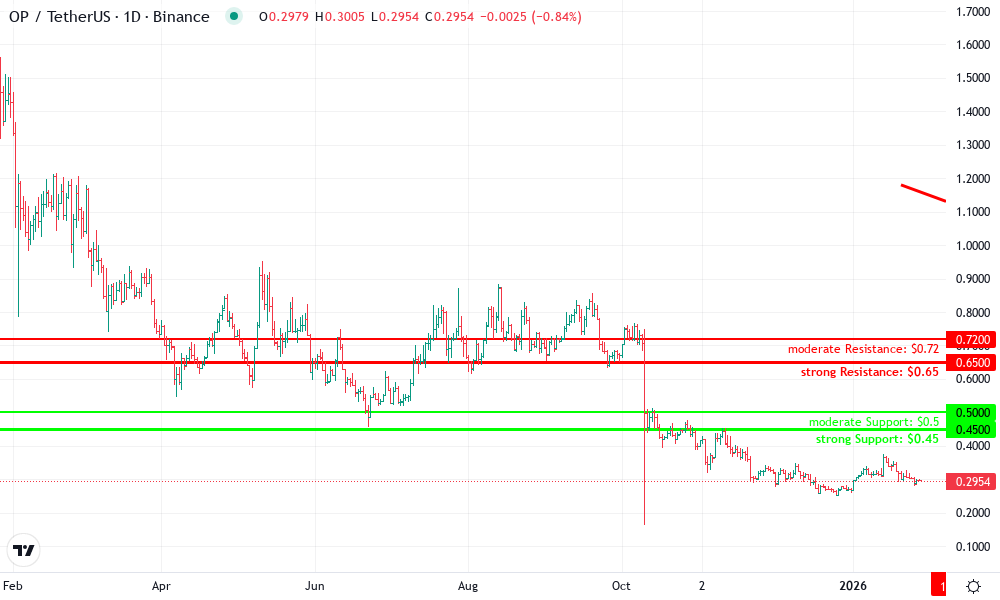
Analysis by Graham Whitaker | Symbol: BINANCE:OPUSDT | Interval: 1W | Drawings: 7
Technical Analysis Summary
To annotate this OPUSDT chart in my conservative style, begin by drawing a prominent downtrend line connecting the early 2026 peak around $1.18 on 2026-01-20 to the recent lows near $0.48 on 2026-10-01, using a thick red trend_line to highlight the dominant bearish structure. Add horizontal_lines at key support $0.45 (strong, green) and resistance $0.65 (strong, red), with moderate levels at $0.50 and $0.60. Enclose the prolonged consolidation phase from mid-April to present with a rectangle spanning 2026-04-15 ($0.55) to 2026-10-15 ($0.48). Mark volume spikes during the February breakdown with arrow_mark_down callouts. Place text labels for MACD bearish divergence near recent lows. Use fib_retracement from the Jan high to Apr low for potential retracement levels at 38.2% ($0.72) and 50% ($0.83). Add horizontal order_line at proposed entry $0.48 and stop $0.42. Finally, vertical_line at 2026-02-15 for the sharp breakdown event, with a callout noting 'Superchain news ignored'. This setup emphasizes capital protection amid lagging price action.
Risk Assessment: medium
Analysis: Bearish technical structure conflicts with robust fundamentals (60% L2 share, buybacks); low volume range risks whipsaw but offers asymmetric upside
Graham Whitaker's Recommendation: Accumulate conservatively near support with tight risk management; protect capital, await volume/breakout confirmation for growth pursuit
Key Support & Resistance Levels
📈 Support Levels:
- $0.45 - Strong multi-test range low, aligns with 78.6% fib retracement strong
- $0.5 - Moderate support from prior swing lows and 50% fib moderate
📉 Resistance Levels:
- $0.65 - Strong overhead resistance at range high, prior breakdown pivot strong
- $0.72 - Moderate resistance at 38.2% fib retracement of decline moderate
Trading Zones (low risk tolerance)
🎯 Entry Zones:
- $0.48 - Near strong support with Superchain growth backing, conservative dip buy low risk
- $0.5 - Confirmation on volume increase above range midline medium risk
🚪 Exit Zones:
- $0.7 - Initial profit target at range high breakout 💰 profit target
- $0.42 - Tight stop below key support to protect capital 🛡️ stop loss
- $0.83 - Secondary target at 50% fib retracement 💰 profit target
Technical Indicators Analysis
📊 Volume Analysis:
Pattern: Declining during consolidation after spike on breakdown
Initial dump volume confirms selling pressure; current low volume suggests apathy, watch for pickup on upside
📈 MACD Analysis:
Signal: Bearish below zero line, no divergence
MACD histogram contracting but negative; potential bullish cross if fundamentals catalyze
Applied TradingView Drawing Utilities
This chart analysis utilizes the following professional drawing tools:
Disclaimer: This technical analysis by Graham Whitaker is for educational purposes only and should not be considered as financial advice. Trading involves risk, and you should always do your own research before making investment decisions. Past performance does not guarantee future results. The analysis reflects the author's personal methodology and risk tolerance (low).
Navigating Risks in Optimism Superchain Adoption
While bullish, a research-driven lens demands scrutiny of headwinds. Sequencer centralization remains a flashpoint; Optimism's permissioned model, though efficient, invites critiques on censorship resistance compared to fully decentralized alternatives. Competition looms from Arbitrum's Orbit stacks and emerging ZK-rollups, potentially eroding the 61.4% L2 fee share if interoperability falters. Moreover, Ethereum's roadmap upgrades, like Prague, could redistribute activity, tempering Superchain's projected 80% L2 transaction capture by 2025 end.
Regulatory shadows also warrant caution. As TVL swells past $4 billion with players like Sony and Coinbase onboard, scrutiny intensifies on stablecoin flows and DeFi leverage. My conservative stance prioritizes protocols with proven antifragility; the Superchain scores high here, bolstered by fault proofs and shared sequencing bridges. Still, investors must monitor governance votes closely, ensuring buybacks don't dilute security budgets.
Quantitative risk assessment reveals resilience: even halving current 11.5 million daily transactions would sustain meaningful buybacks, given 58.6% L2 dominance. Volatility in ETH prices impacts revenue, but hedging via protocol treasuries mitigates this. For portfolios, allocate judiciously; Superchain exposure via OP offers asymmetric upside, buffered by revenue ties.
Charting the Path Forward for Rollup Ecosystem Leadership
Projections paint a dominant arc. With 60% Ethereum L2 transactions already in grasp, and daily volumes stabilizing at 11.5 million amid $4 billion TVL, the Superchain cements its role as Ethereum's scalability vanguard. Integrations from Kraken, Uniswap, and World Chain amplify network effects, fostering DeFi hubs and social primitives at sub-cent costs. By year-end 2025, 80% L2 hegemony seems plausible, propelled by developer tooling and governance innovations like this buyback scheme.
For institutional stewards, the mandate is clear: protect capital by tracking core metrics, pursue growth through measured Superchain bets. OP's evolution from governance token to revenue-backed asset embodies blockchain maturity. As transaction growth compounds, the multi-rollup vision transitions from thesis to reality, rewarding patient allocators who discern signal from noise in the L2 arena.


No comments yet. Be the first to share your thoughts!