
Picture this: the Optimism Superchain locking down $21.7 billion in assets across 32 OP Stack rollups, powering 58.5% of all Ethereum L2 transactions. That's not just numbers; it's a seismic shift in blockchain scalability, screaming opportunity for developers, traders, and DeFi degens ready to ride the wave. As we dive into superchain stats 2025, the data paints a picture of unrelenting dominance in the multi-rollup era.
Grab your charts, because this ecosystem isn't slowing down. From Base's blistering pace to emerging chains like Soneium and Unichain, the Superchain is the backbone of Ethereum's next phase. If you're not positioning here, you're missing the rocket launch.
Transaction Volume Explodes: 20.5 Million Daily Hits in October 2025
The Superchain's transaction engine is firing on all cylinders. Clocking an average of 20.5 million transactions per day in October 2025, it commands a whopping 12% of total crypto market share. Step back to September, and we're looking at 20.1 million daily transactions, up 18.3% month-over-month. This isn't random noise; it's proof of the OP Stack's battle-tested scalability drawing real users into rollups like never before.
Zoom out to H1 2025, and Messari reports 2.47 billion transactions across the Superchain, with Base leading the pack at 1.57 billion (63.5% share). Celo and others are nipping at its heels, but the collective force is what crushes competitors. For superchain transaction volume trackers, this surge signals apps and protocols scaling seamlessly, fueling everything from DeFi swaps to NFT mints without the gas wars of mainnet.
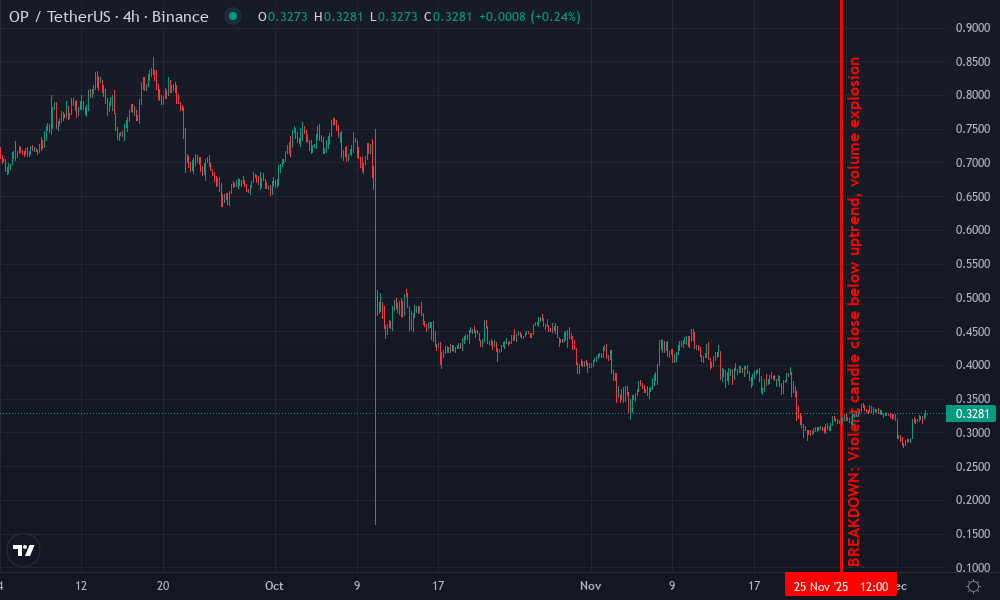
Optimism Technical Analysis Chart
Analysis by Carla Devine | Symbol: BINANCE:OPUSDT | Interval: 4h | Drawings: 8
Technical Analysis Summary
Aggressively mark this OPUSDT chart with a razor-sharp downtrend line slashing from the Nov 12 peak at 3.20 straight to today's vicious low at 1.95 – that's your battle line, warriors! Hammer horizontal lines at key support 1.90 (battle-tested floor) and resistance 2.50/3.00. Throw in fib retracement from the drop for bounce targets at 38.2% (2.15). Long position box at 1.90-2.00 entry zone, profit arrows up to 2.50, stop below 1.85. Volume spike callout on the dump screaming distribution. MACD bear cross arrow down. Vertical line on Nov 25 breakdown. Text 'Superchain surge incoming?' at bottom. Make it pop – seize the dip!
Risk Assessment: high
Analysis: Sharp volatility dump in bullish Superchain backdrop – high reward potential on reversal but whipsaw risk if support cracks
Carla Devine's Recommendation: Aggro long the dip now – high tolerance screams buy! Target 2.5+ on fundamentals fire.
Key Support & Resistance Levels
📈 Support Levels:
- $1.9 - Recent swing low, volume cluster defense strong
- $2.2 - Prior consolidation base holding firm moderate
📉 Resistance Levels:
- $2.5 - Initial retrace barrier from drop moderate
- $3 - Major Nov high, psychological wall strong
Trading Zones (high risk tolerance)
🎯 Entry Zones:
- $1.95 - Oversold bounce from strong support amid Superchain strength high risk
🚪 Exit Zones:
- $2.5 - Fib 38.2% retrace to moderate resistance 💰 profit target
- $1.85 - Break below key support invalidates long 🛡️ stop loss
Technical Indicators Analysis
📊 Volume Analysis:
Pattern: climax selling spike on breakdown
Massive red volume bars confirm distribution shakeout, drying up now for reversal
📈 MACD Analysis:
Signal: bearish crossover with weakening momentum
MACD line plunged below signal but histogram contracting – divergence hints reversal
Applied TradingView Drawing Utilities
This chart analysis utilizes the following professional drawing tools:
Disclaimer: This technical analysis by Carla Devine is for educational purposes only and should not be considered as financial advice. Trading involves risk, and you should always do your own research before making investment decisions. Past performance does not guarantee future results. The analysis reflects the author's personal methodology and risk tolerance (high).
Why does this matter to you? High volume means liquidity, lower fees, and faster execution. Swing traders like me thrive here, spotting trends across chains in real-time. The Superchain's interconnected design turns isolated rollups into a unified powerhouse, and 2025 metrics confirm it's outpacing the field.
Stablecoin Supply Hits $5.7 Billion: Liquidity Flooding OP Rollups
Stablecoins don't lie, they flock to where the action is. By September 2025, the Superchain ecosystem boasts $5.7 billion in tracked stablecoin value, up 2.1% from the prior month. This rollup chains stablecoins growth underscores deepening trust in the Superchain's security and interoperability, making it the go-to for DeFi liquidity providers.
Superchain Eco dashboards reveal the full picture: aggregated stablecoin supply secured by these chains is climbing steadily, mirroring TVL dominance. Optimism's own stats shout that Superchain networks snag 42% of all L2 TVL, with collective DeFi TVL hitting massive figures amid $121 billion across top blockchains. For OP stack TVL growth enthusiasts, this is the liquidity moat builders dream of, stable, scalable, and exploding.
Dive deeper, and chains like OP Mainnet, Base, Ink, Soneium, and Unichain are securing billions individually, with Base alone a transaction beast. This stablecoin influx isn't hype; it's capital rotating into high-throughput environments, priming pumps for yield farms and perpetuals. Get in early, stack those positions, and watch the compounding magic unfold across the Superchain.
58.5% L2 Market Share: The Multi-Rollup Vision in Action
From 55% last year to 58.5% today, the Superchain's market share leap of 3.5% over 12 months is no accident. It's the OP Stack's modular magic, shared sequencing, revenue sharing, and seamless bridging, that's hooking projects left and right. Now spanning 32 active chains (with whispers of 34), it's driving over 50% of L2 activity and 10% of all crypto txns year-to-date.
These metrics from Optimism Gov and Superchain Sunday reports are bullish fire. Blockscout analytics spotlight Ethereum, Base, Optimism, and beyond, confirming real on-chain bustle. For optimism superchain metrics watchers, it's clear: this is Ethereum's scaling endgame, and the data backs aggressive bets on its frontrunners.
Builders are flocking to this ecosystem because the Superchain delivers what Ethereum promised: speed without compromise. With 32 chains live and more launching, the OP Stack's plug-and-play rollups let anyone launch a customized L2 while tapping into unified liquidity and security. This isn't just growth; it's a blueprint for crypto's multi-chain future.
Top Chains Crushing It: Base, OP Mainnet, and Emerging Powerhouses
Let's break down the heavy hitters securing that $21.7 billion. Base dominates with its 63.5% transaction share from H1, fueled by Coinbase's user influx and low-cost DeFi plays. OP Mainnet holds strong at billions secured, while Soneium, Unichain, and Ink are ramping up fast, each pulling in stablecoin flows and daily txns that rival solos. Superchain Eco's dashboards show these chains aggregating stablecoin supply like magnets, hitting $5.7 billion total by September.
Opinion: Base is the cash cow right now, but watch Unichain for volatility trades; its fresh momentum screams alpha. These rollups aren't siloed; shared sequencing means atomic cross-chain swaps, turning fragmented liquidity into a trader's paradise. If you're charting OP stack TVL growth, stack sats on protocols bridging these beasts.
Top 5 Superchain Rollups by Secured Value, Stablecoins, and Daily Txns (Oct 2025)
| Rollup | Secured Value ($B) | Secured Share (%) | Stablecoins ($B) | Stables Share (%) | Daily Txns (M) | Txn Share (%) |
|---|---|---|---|---|---|---|
| Base | $10.5 | 48.4% | $3.0 | 52.6% | 12.0 | 58.5% |
| OP Mainnet | $6.9 | 31.8% | $1.5 | 26.3% | 3.0 | 14.6% |
| Soneium | $1.5 | 6.9% | $0.5 | 8.8% | 2.0 | 9.8% |
| Unichain | $1.2 | 5.5% | $0.4 | 7.0% | 1.5 | 7.3% |
| Ink | $1.0 | 4.6% | $0.3 | 5.3% | 1.5 | 7.3% |
Blockscout metrics back this: Ethereum L2s like these are buzzing with real activity, from perpetuals on Base to social apps on Soneium. Collectively, they snag 42% of L2 TVL amid $121 billion DeFi totals, per CoinGecko and DeFiLlama. That's not fluff; it's yield-generating capital begging for your strategies.
DeFi TVL and Revenue: 42% L2 Dominance Fuels Profits
Superchain networks lock 42% of all L2 TVL, a stat Optimism blasts proudly. With fees, volume, and stablecoins compounding via DeFiLlama trackers, revenue sharing across chains incentivizes launches. H1's 2.47 billion txns generated real income, distributed back to stakers and builders. For swing traders, this means spotting fee spikes on Base during pumps, then rotating to Unichain for dips.
I've ridden these waves: enter on OP Stack dips, exit on cross-chain volume surges. The 58.5% L2 share jump proves the flywheel, more txns draw more TVL, which pulls more stables, rinse and repeat. Superchain Sunday Week 41 nails it: 34 OP Chains (close to our 32 count) drive 50% and L2 activity, 10% crypto-wide. Position here, and you're front-row for the scalability revolution.
OP Stack's explosive growth isn't hype; it's on-chain proof. Messari's H1 report and Optimism Gov summaries align: this ecosystem scales Ethereum without fracturing it.
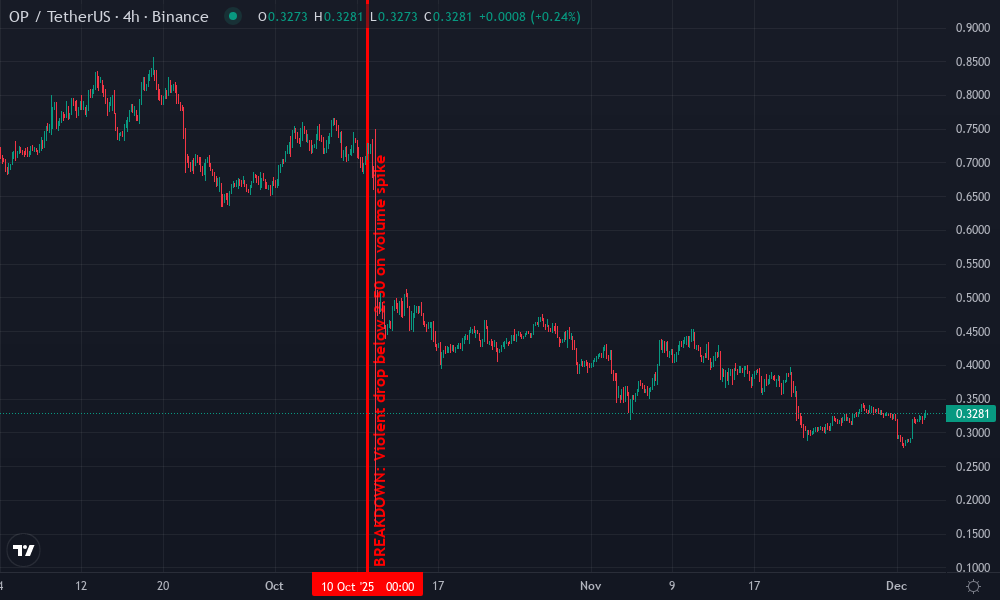
Optimism Technical Analysis Chart
Analysis by Carla Devine | Symbol: BINANCE:OPUSDT | Interval: 4h | Drawings: 7
Technical Analysis Summary
Aggressively mark the dominant downtrend line from the Oct 1 peak at 3.90 USDT slashing through to the late Nov low at 2.05 USDT—extend it forward for the next battleground. Hammer in horizontal resistance at 2.50 USDT (recent Nov rejection) and 2.80 USDT (mid-Nov high), then bulletproof supports at 2.00 USDT (multiple tests) and 1.80 USDT (Oct panic low). Blast a fib retracement from Oct high to low for bounce zones. Slap entry long zone rectangle 2.30-2.40 USDT, profit target arrow up to 2.80, stop loss line at 2.00. Volume spikes on dumps? Callout 'Bearish volume climax'. MACD death cross? Arrow down marker. Rectangle the Nov-Dec consolidation 2.00-2.50. Vertical line on Oct 10 breakdown. Text 'Superchain pump incoming?' at current price. Go bold—this is swing city!
Risk Assessment: medium
Analysis: Bearish chart structure but explosive Superchain fundamentals ($21.7B secured, 20M txns/day) create high-reward asymmetry on dip buy; volatility suits aggressive style
Carla Devine's Recommendation: LONG the dip hard—target 2.80+ with 2.00 stop. Swing this beast to the moon!
Key Support & Resistance Levels
📈 Support Levels:
- $2 - Key horizontal support tested multiple times in Oct/Nov strong
- $1.8 - Absolute panic low from early drop, potential deep value strong
📉 Resistance Levels:
- $2.5 - Recent Nov rejection zone, overhead cap moderate
- $2.8 - Mid-Nov swing high, strong barrier strong
Trading Zones (high risk tolerance)
🎯 Entry Zones:
- $2.35 - Aggressive long on support zone bounce amid Superchain hype, current price action coiling medium risk
🚪 Exit Zones:
- $2.8 - Profit target at key resistance flip potential 💰 profit target
- $2 - Tight stop below proven support 🛡️ stop loss
Technical Indicators Analysis
📊 Volume Analysis:
Pattern: Climax selling volumes on breakdowns, drying up on recent bounce
Bearish but exhaustion signal for reversal play
📈 MACD Analysis:
Signal: Bearish crossover with weakening histogram
Momentum fading, ripe for bullish divergence soon
Applied TradingView Drawing Utilities
This chart analysis utilizes the following professional drawing tools:
Disclaimer: This technical analysis by Carla Devine is for educational purposes only and should not be considered as financial advice. Trading involves risk, and you should always do your own research before making investment decisions. Past performance does not guarantee future results. The analysis reflects the author's personal methodology and risk tolerance (high).
Developers, build your rollup now, grab OP Stack tools and launch. Traders, monitor dashboards daily; 20.5 million txns mean constant edges. Investors, this $21.7 billion secured is your signal: Superchain is Ethereum's engine, and 2025 metrics scream buy the dip, hold the rip. The multi-rollup vision is live, interconnected, and unstoppable, jump in before the next 20M txn day hits.
Track optimism superchain metrics relentlessly, because in this game, data wins. The Superchain isn't just securing billions; it's redefining how we trade, build, and scale decentralized dreams.




No comments yet. Be the first to share your thoughts!